During the charge and discharge process of the battery, as the charge and discharge depth changes, the voltage is also constantly changing. If we use capacity as the horizontal coordinate and voltage as the vertical coordinate, we can get a simple charge and discharge curve, which contains many clues about the battery's electrical performance. These curves drawn with the battery cell parameters such as time, capacity, SOC, voltage, etc. involved in charge and discharge as coordinates are called charge and discharge curves. Here are some common charge and discharge curves.
Time-current/voltage curve
● Constant current
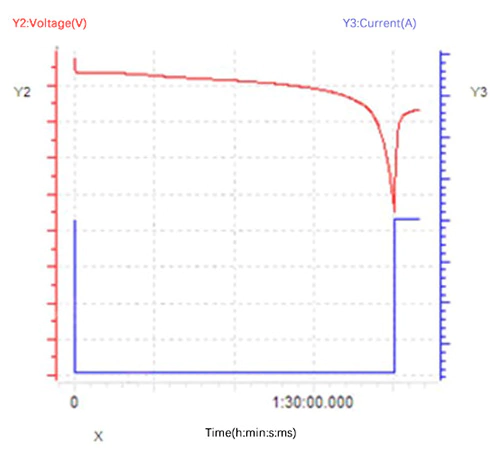
During constant current charging and discharging, the current is constant, and the change of the battery terminal voltage is collected at the same time, which is often used to detect the discharge characteristics of the battery. During the discharge process, the discharge current remains unchanged, the battery voltage decreases, and the discharge power also continues to decrease. The sample curve is shown in the figure below.
● Constant current and constant voltage (charging)
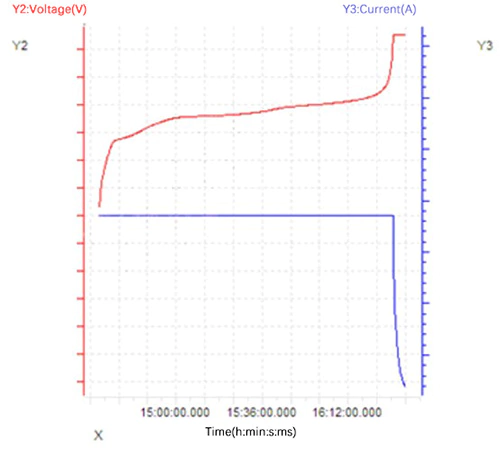
Compared with constant current charging, constant current constant voltage charging has a constant voltage process at the end of charging. At the end of charging, the voltage becomes constant when it reaches the target value, while the current gradually decreases. When the cut-off current is reached, the constant current constant voltage charging ends. Since the battery voltage fluctuates greatly after leaving the plateau period, if constant current charging is continued, the battery cannot reach the ideal full charge state. Therefore, it is necessary to switch to constant voltage and reduce the current to ensure that the battery reaches a higher state of charge as much as possible. The sample curve is shown in the figure below.
● Constant power
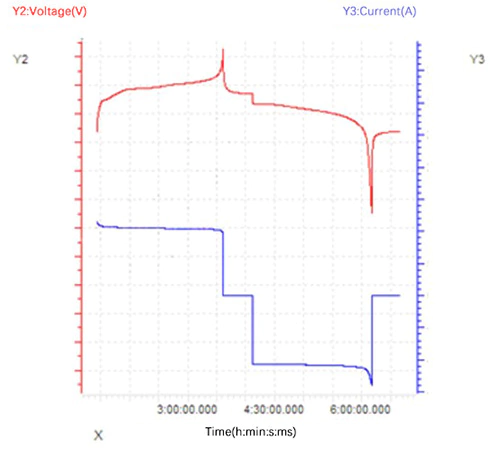
The entire charging and discharging process is operated at constant power. According to P=UI, the voltage gradually increases and the current gradually decreases during constant power charging, and the voltage gradually decreases and the current gradually increases during constant power discharging. According to the conventional charging and discharging cut-off voltage of LFP battery 3.65-2.5V, the discharge end current can reach nearly 1.5 times the charging end current. The example curve is shown in the figure below.
● Continuous, intermittent, pulse
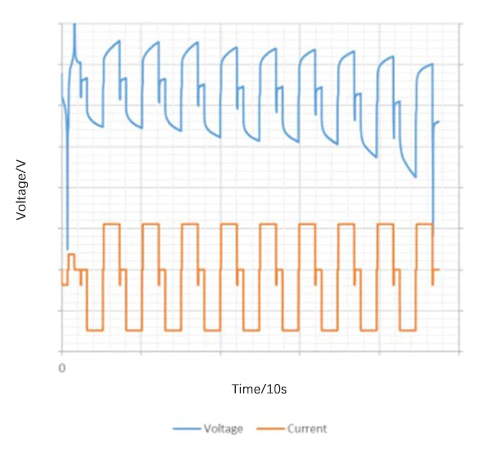
At constant current or power, the timing function is used to achieve continuous, intermittent and pulse charge and discharge control. These special charge and discharge regimes are often used to evaluate the DC internal resistance of the battery. The sample curve is shown in the figure below.
Capacity-voltage curve
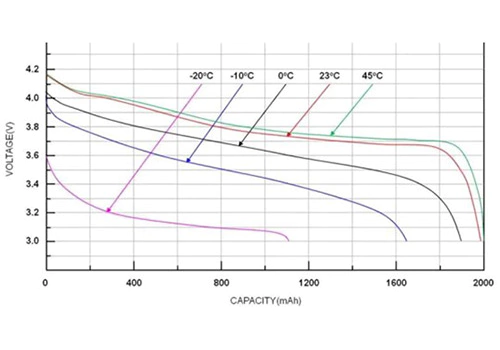
The horizontal axis of the capacity-voltage curve reflects the battery's charge and discharge capacity, state of charge and other information, while the vertical axis includes the battery's voltage platform, inflection point, polarization and other information. The figure below is a discharge curve of a lithium iron phosphate battery at different temperatures.
Rate curve
The current density affects the rate of electrochemical reaction, thus changing the performance parameters of the battery. When comparing batteries of different capacities, the same current is not applicable, so the rate is used to determine the relative current. For example, 0.1C is 0.3A for a 3Ah 18650 battery, and 28A for a 280Ah prismatic battery. Simply put, the specific current value represented by the rate is the rate multiplied by the battery capacity.
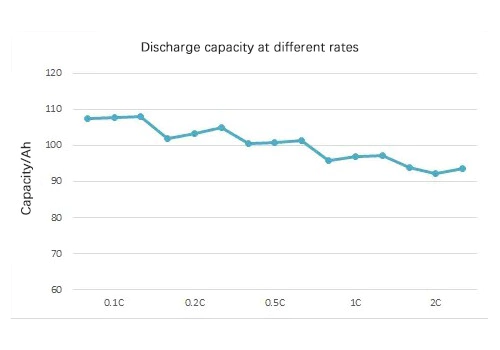
When marking the capacity of a battery, the charge and discharge current must be taken into account, because the capacity will be different at different rates. For example, to calibrate the capacity of a battery at different rates, you can set it to change step by step with the charge and discharge cycle rate, and then draw a rate curve with the discharge capacity as the vertical axis and the number of charge and discharge times as the horizontal axis.
dQ/dV curve
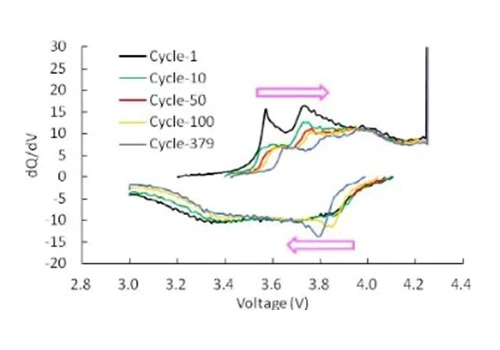
The name of the dQ/dV curve is its y-axis variable, that is, the rate of change of the volume per unit voltage interval. The horizontal axis of the dQ/dV curve is generally SOC, capacity or voltage, which reflects the change in the rate of change of capacity. The place where the rate of change is large is displayed as a characteristic peak on the curve, which generally corresponds to an electrochemical reaction process.
The dQ/dV curve can tell us where the voltage platform of the battery is, when the electrochemical reaction occurs, and how the reaction process changes with battery aging and other changes in state. Generally speaking, chemical reactions are rapid, so the data points on the curve require higher accuracy. Therefore, the output dQ/dV curve has certain requirements for the collection of raw data, otherwise it is impossible to make a curve with obvious peaks. When doing charge and discharge tests, you can set the voltage intervalΔV=10~50mV to collect data, or the time intervalΔt=10-50ms, and then screen the raw data with equal voltage differences.
The following figure shows the dQ/dV curve under different number of cycles.
Cycle Curve
We know that the life of a battery is divided into calendar life and cycle life. Calendar life is the time it takes for the battery capacity to lose to a certain extent under natural placement, while cycle life is the number of times the battery is continuously charged and discharged until its capacity decays to a certain extent. Cycle life is one of the important indicators for measuring battery life performance.
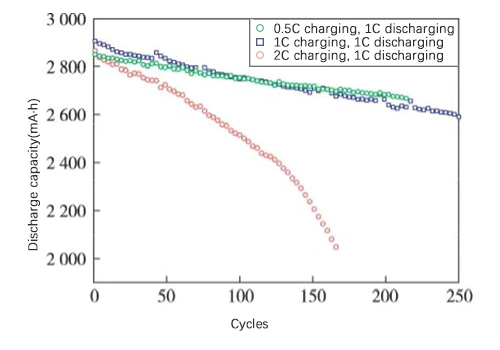
The cycle test data of lithium-ion batteries is the accumulation of single charge and discharge data. Different single charge and discharge data can be extracted to make multiple curves for different aspects of analysis. The simplest cycle life curve is with the number of cycles as the x-axis and the discharge capacity or capacity retention rate as the y-axis, as shown in the figure below. As the cycle progresses, the battery capacity continues to decay, and the charge and discharge system has a significant impact on the battery capacity decay.
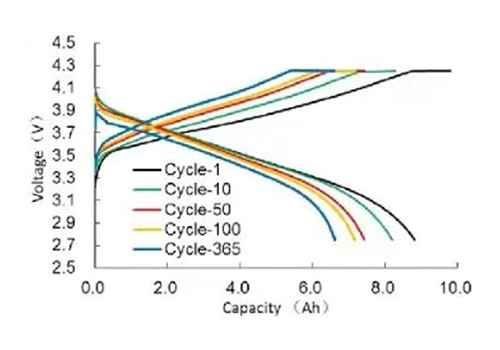
You can also compare the capacity-voltage curves of charge and discharge at different times, as shown in the figure below. As the cycle progresses, the charge and discharge starting voltage shifts, the DC internal resistance of the battery changes, and the charge and discharge capacity gradually decays.
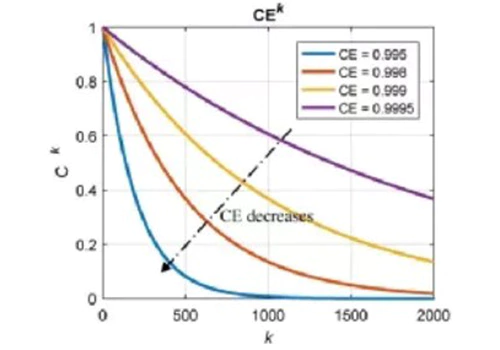
In addition to the above two types, there are many other curves with the number of cycles as the horizontal axis and the parameters affected by battery cycle attenuation as the vertical axis, which play a role in analyzing the factors affecting the cycle life of the battery cell and predicting the cycle life. As shown in the figure below, it reflects the theoretical value of the battery cycle life affected by the coulomb efficiency level. CE is the coulomb efficiency, Ck is the capacity retention rate, and k is the number of cycles.
TOB NEW ENERGY provides a full set of battery tester for battery research and manufacturing